
Survey Overview
The latest Quantus Polls and News national survey, conducted among 1,000 registered voters, provides a snapshot of the 2024 presidential race, revealing a highly competitive contest between Vice President Kamala Harris and former President Donald Trump. With Harris leading by a narrow margin of 47.2% to Trump’s 45.9%, the results underscore the competitive nature of the election (see survey questions and cross tabs). The survey also delves into voter opinions on key issues, the candidates’ favorability ratings, and overall trust in their ability to handle critical national concerns.
Survey Methodology
This survey was conducted online using the Pollfish online panel over two days, from August 7th to August 8th, 2024. The survey sample comprised 1,000 registered voters, carefully selected and weighted to mirror the national demographic and political landscape. The margin of error for the survey stands at +/- 3.1%, providing a reliable reflection of public sentiment at this point in the election. The survey employed robust sampling techniques, ensuring that the data accurately represents the diverse electorate.
Weighting Methodologies
To achieve a representative sample, the survey results were weighted across multiple demographic variables, including gender, age, race/ethnicity, education, and region. The iterative proportional fitting (raking) method was used to align the sample with known population parameters, enhancing the accuracy of the survey in reflecting the broader electorate. This weighting ensures that the insights derived from the survey can be generalized to the entire registered voter population.
Demographic Breakdown:
- Gender: 51% Female, 49% Male
- Age: 18-34 (26%), 35-49 (25%), 50-64 (24%), 65+ (25%)
- Race/Ethnicity: 70% White, 12% Black, 12% Hispanic, 6% Other
- Education: 38% College Graduates, 62% Non-College Graduates
- Region: 17% Northeast, 21% Midwest, 38% South, 24% West
Key Findings
Question 1: Did you vote in the 2020 presidential election? If so, which candidate did you support?
- Joe Biden (Democrat): 48.8%
- Donald Trump (Republican): 44.1%
- Another candidate: 3.2%
- Don’t remember/didn’t vote: 3.9%
The results indicate that most respondents supported Joe Biden in the 2020 election, reflecting a the democratic leaning electorate in the last presidential election.
Question 2: Which of the following best describes you politically?
- Democrat: 34.3%
- Republican: 32.9%
- Independent: 32.8%

The political identification of respondents is nearly evenly split among Democrats, Republicans, and Independents. This distribution highlights the potential for electoral shifts depending on candidate appeal and campaign strategies.
Question 3: Overall opinion of Vice President Kamala Harris
- Very Favorable: 24.8%
- Favorable: 22.8%
- Unfavorable: 15.4%
- Very Unfavorable: 33.8%
- Not sure/Don’t know: 3.2%
Kamala Harris’s favorability is mixed, with 47.6% of respondents holding a favorable view, while 49.2% view her unfavorably. The high percentage of very unfavorable opinions (33.8%) suggests a significant portion of the electorate is strongly opposed to her candidacy.
Question 4: Overall opinion of former President Donald Trump
- Very Favorable: 20.7%
- Favorable: 24.5%
- Unfavorable: 14.6%
- Very Unfavorable: 38.3%
- Not sure/Don’t know: 1.9%
Donald Trump’s favorability is similarly polarized, with 45.2% of respondents viewing him favorably compared to 52.9% who view him unfavorably. The substantial percentage of very unfavorable opinions (38.3%) highlights the intense opposition Trump faces among certain voter segments.
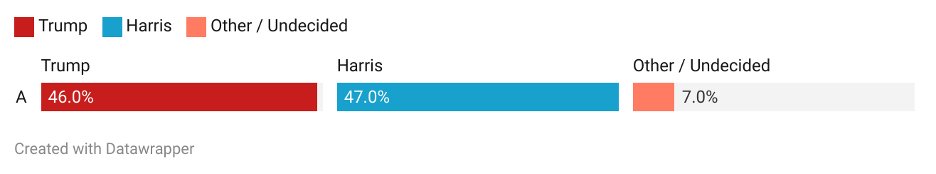
Question 5: If the U.S. presidential election were held today and your choices are between former President Trump and Vice President Harris, who would you support?
- Kamala Harris, the Democrat: 47.2%
- Donald Trump, the Republican: 45.9%
- Undecided/Other: 6.9%
The race is nearly a dead heat, with Harris holding a marginal lead over Trump within the margin of error. The cross-tabulation data provides deeper insights into how different demographics are shaping up in this tight race:
- Gender: Trump leads among men (52%), while Harris is favored by women (53%).
- Age: Trump has stronger support among older voters aged 50-64 (48%), whereas Harris is more popular among younger voters aged 18-34 (48%).
- Independents: Harris leads among independents by one point (44%) over Trump (43%).
- Race: Harris is overwhelmingly favored by Black voters (77%) and Hispanic voters (54%), while Trump is preferred by White voters (53%).
- Education: Harris leads among college graduates (53%), while Trump is more popular among those without a college degree (49%).
- Region: Harris leads in the Northeast (49%) and West (51%), while Trump leads by one point in Midwest battleground region (47%) and South (50%).
Question 6: Who do you trust most to handle these issues?
- Economy and Jobs: Trump 50.1%, Harris 47.3%
- Immigration and Border Security: Trump 50%, Harris 41.6%
- Crime and Safety: Trump 46.9%, Harris 45%
- National Security/Foreign Policy: Trump 48.5%, Harris 47.5%
- Abortion Rights and Restrictions: Trump 33.8%, Harris 56.3%
- Neither candidate: 4.4%
Trump is seen as more trustworthy on economic and security issues, with a significant edge in handling immigration. Harris, however, is strongly preferred on abortion rights, an issue that could prove pivotal in mobilizing female voters.
Question 7: Regardless of who you support, who do you think is most likely to win the upcoming U.S. presidential election?
- Donald Trump, the Republican: 41.4%
- Kamala Harris, the Democrat: 42.8%
- Not sure/don’t know: 15.8%
The electorate is almost evenly divided on their predictions of the election outcome, with Harris slightly ahead in perceived likelihood of winning. A substantial portion of voters (15.8%) remains uncertain, reflecting the unpredictability of the race.
Question 8: Do you approve or disapprove of the job Kamala Harris is doing as Vice President of the United States?
- Strongly Approve: 24.4%
- Somewhat Approve: 22.9%
- Strongly Disapprove: 31.2%
- Somewhat Disapprove: 15.7%
- Not sure/don’t know: 5.8%
Harris has a slightly positive approval rating, with 47.3% approving of her job performance compared to 46.9% who disapprove. The balance between approval and disapproval ratings suggests a highly contested perception of her effectiveness as Vice President.
Question 9: Thinking back, do you approve or disapprove of the job Donald Trump did as President of the United States?
- Strongly Approve: 25.9%
- Somewhat Approve: 21.5%
- Strongly Disapprove: 36.6%
- Somewhat Disapprove: 14.0%
- Not sure/don’t know: 2%
Trump’s retrospective job approval ratings are similarly divided, with a slight majority (50.6%) disapproving of his performance as President, compared to 47.4% who approve. The intensity of disapproval is underscored by the 36.6% who strongly disapprove of his tenure.
Conclusion
The Quantus Polls and News survey highlights a deeply polarized electorate, with both Kamala Harris and Donald Trump garnering nearly equal support among registered voters. The demographic divides are stark, with significant differences in candidate support based on gender, age, race, education, and region. These divides suggest that both candidates face challenges in overcoming high unfavorable ratings and in securing broad-based support. As the race tightens, the focus will likely shift towards mobilizing core supporters and appealing to the small but critical segment of undecided voters.
Implications
Given the razor-thin margins and the number of undecided voters, both campaigns must carefully strategize to target key demographics such as younger voters, racial minorities, and voters of swing regions in the Midwest. The slight edge that Harris currently holds in the poll could easily shift as the campaign progresses, making it essential for both candidates to remain disciplined and agile as the race undoubtedly will intensify after the Democratic National Convention (August 19th – August 22nd). With the electorate so closely divided, the outcome of the 2024 election will hinge on the ability of each campaign to effectively mobilize their base supporters and appeal to the small but crucial group of persuadable voters.
Follow Quantus Polls and News on X (Twitter).


